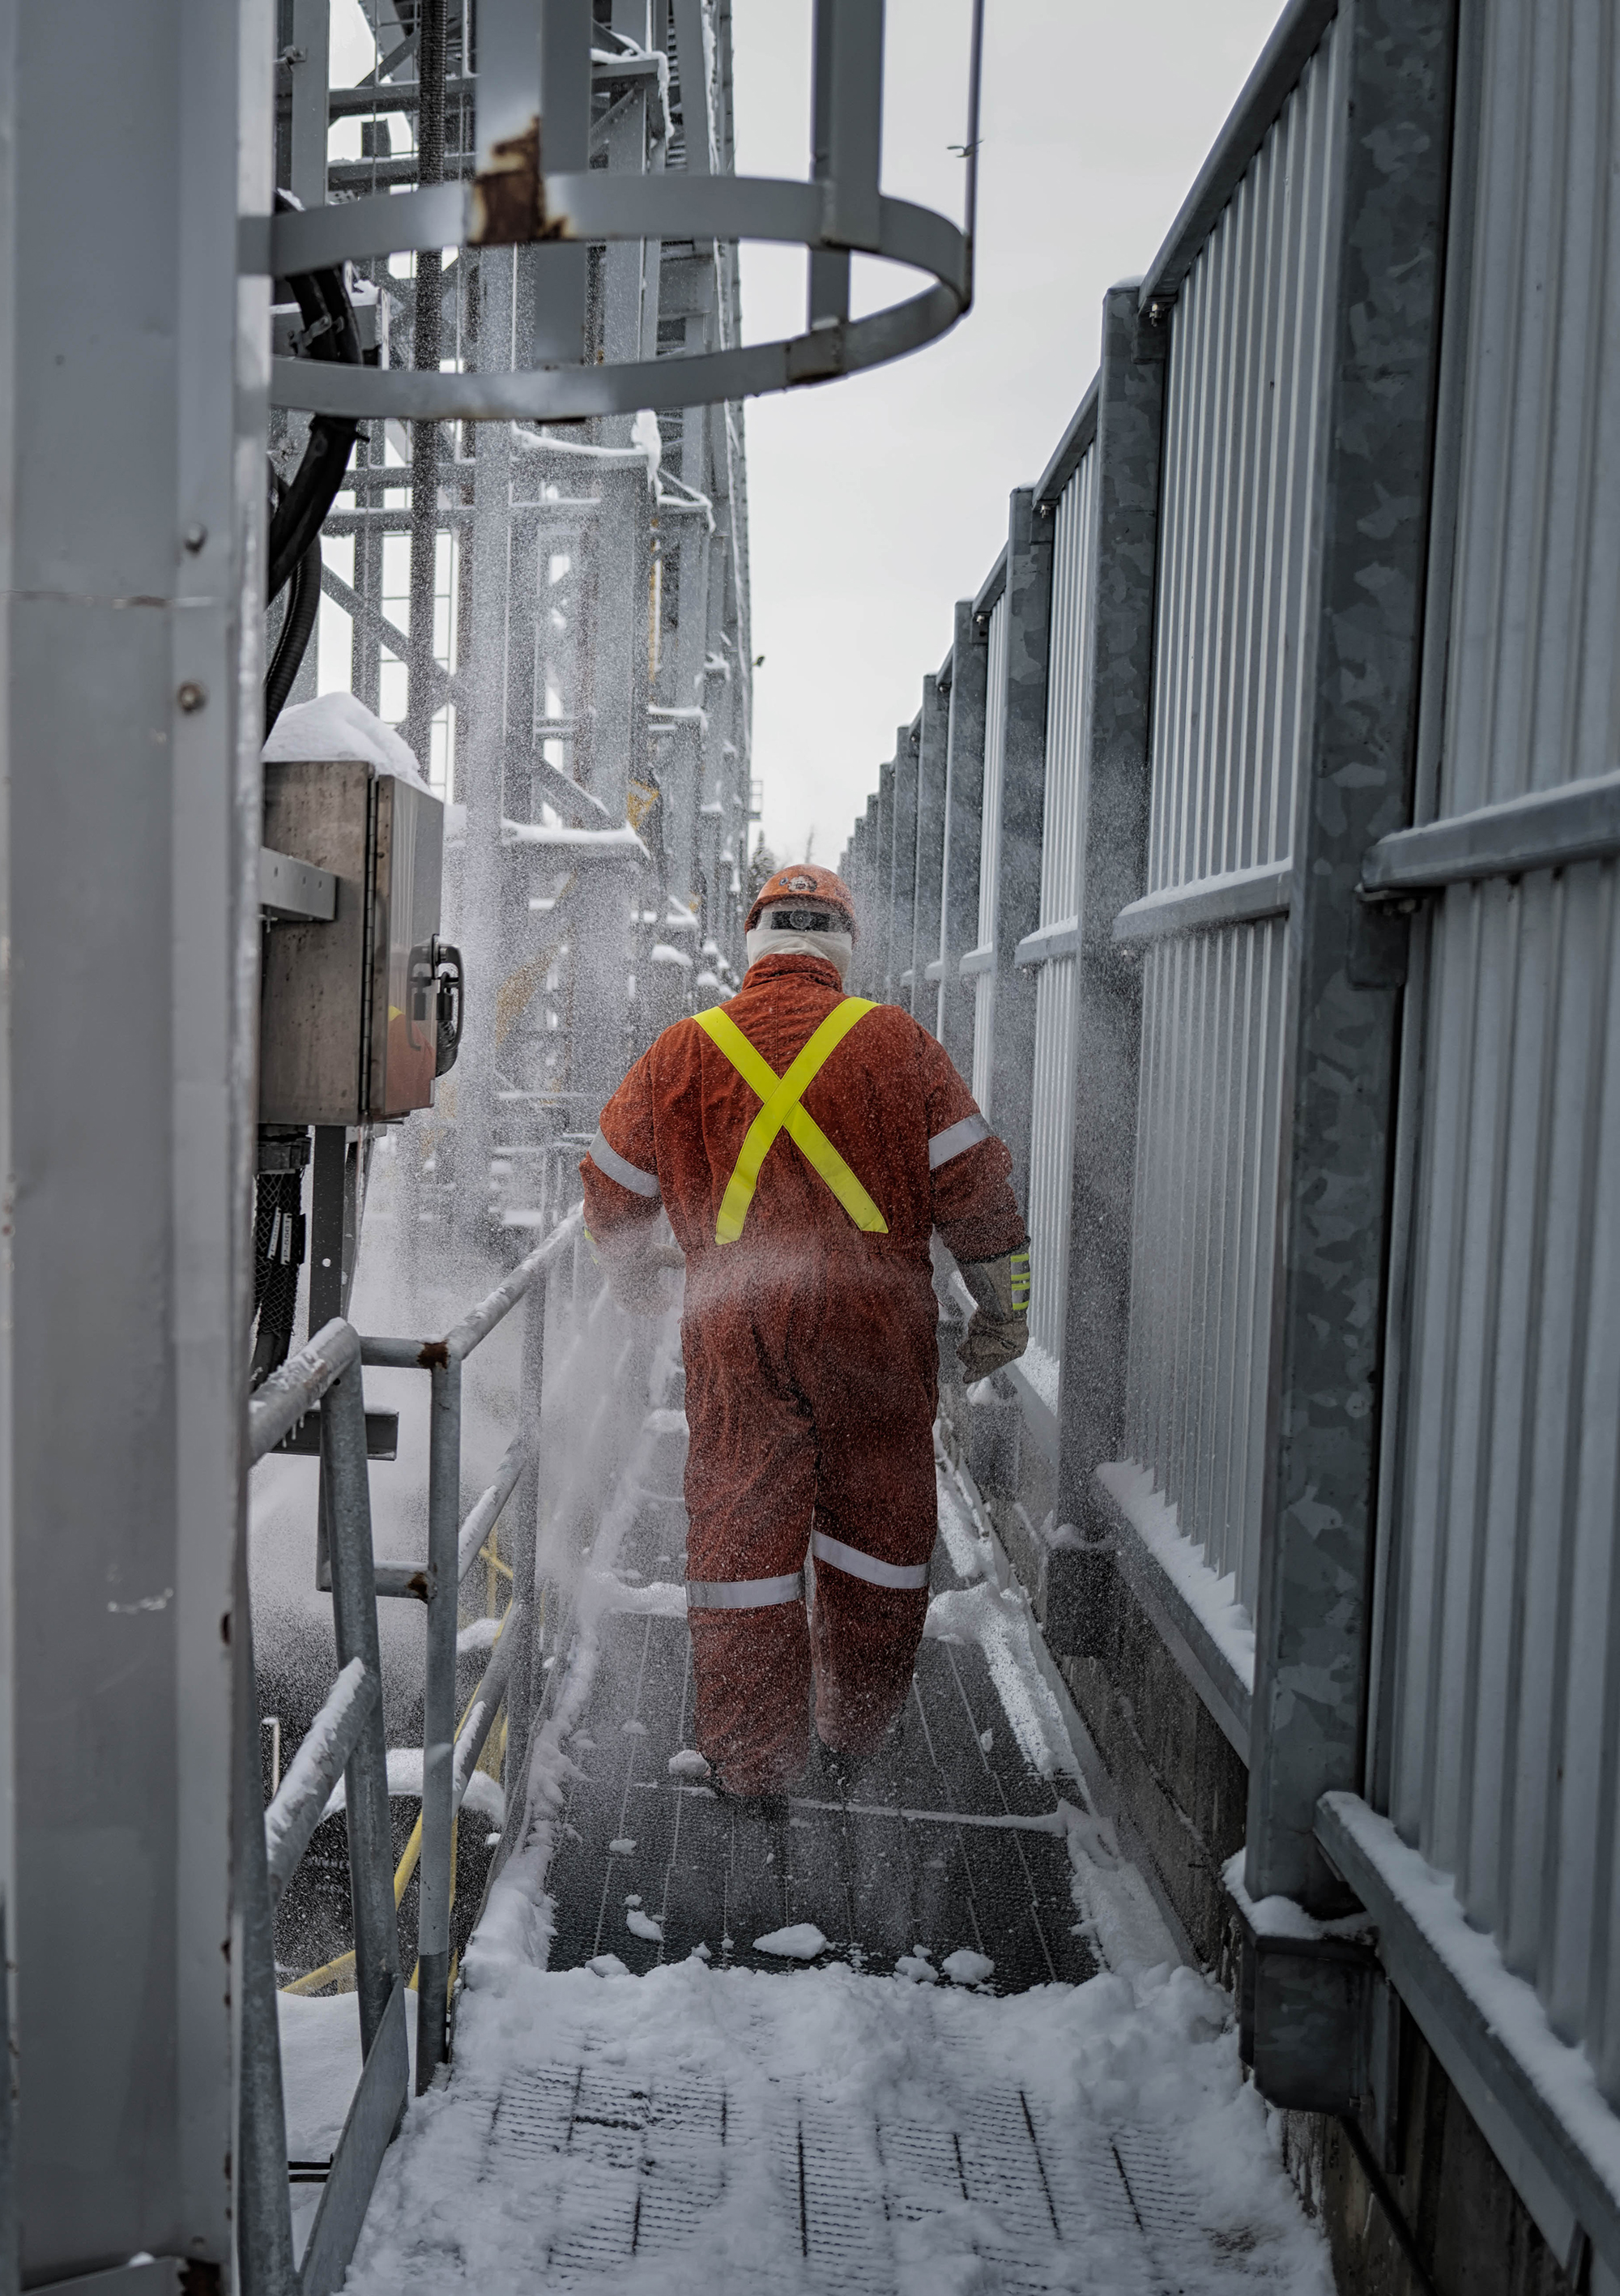
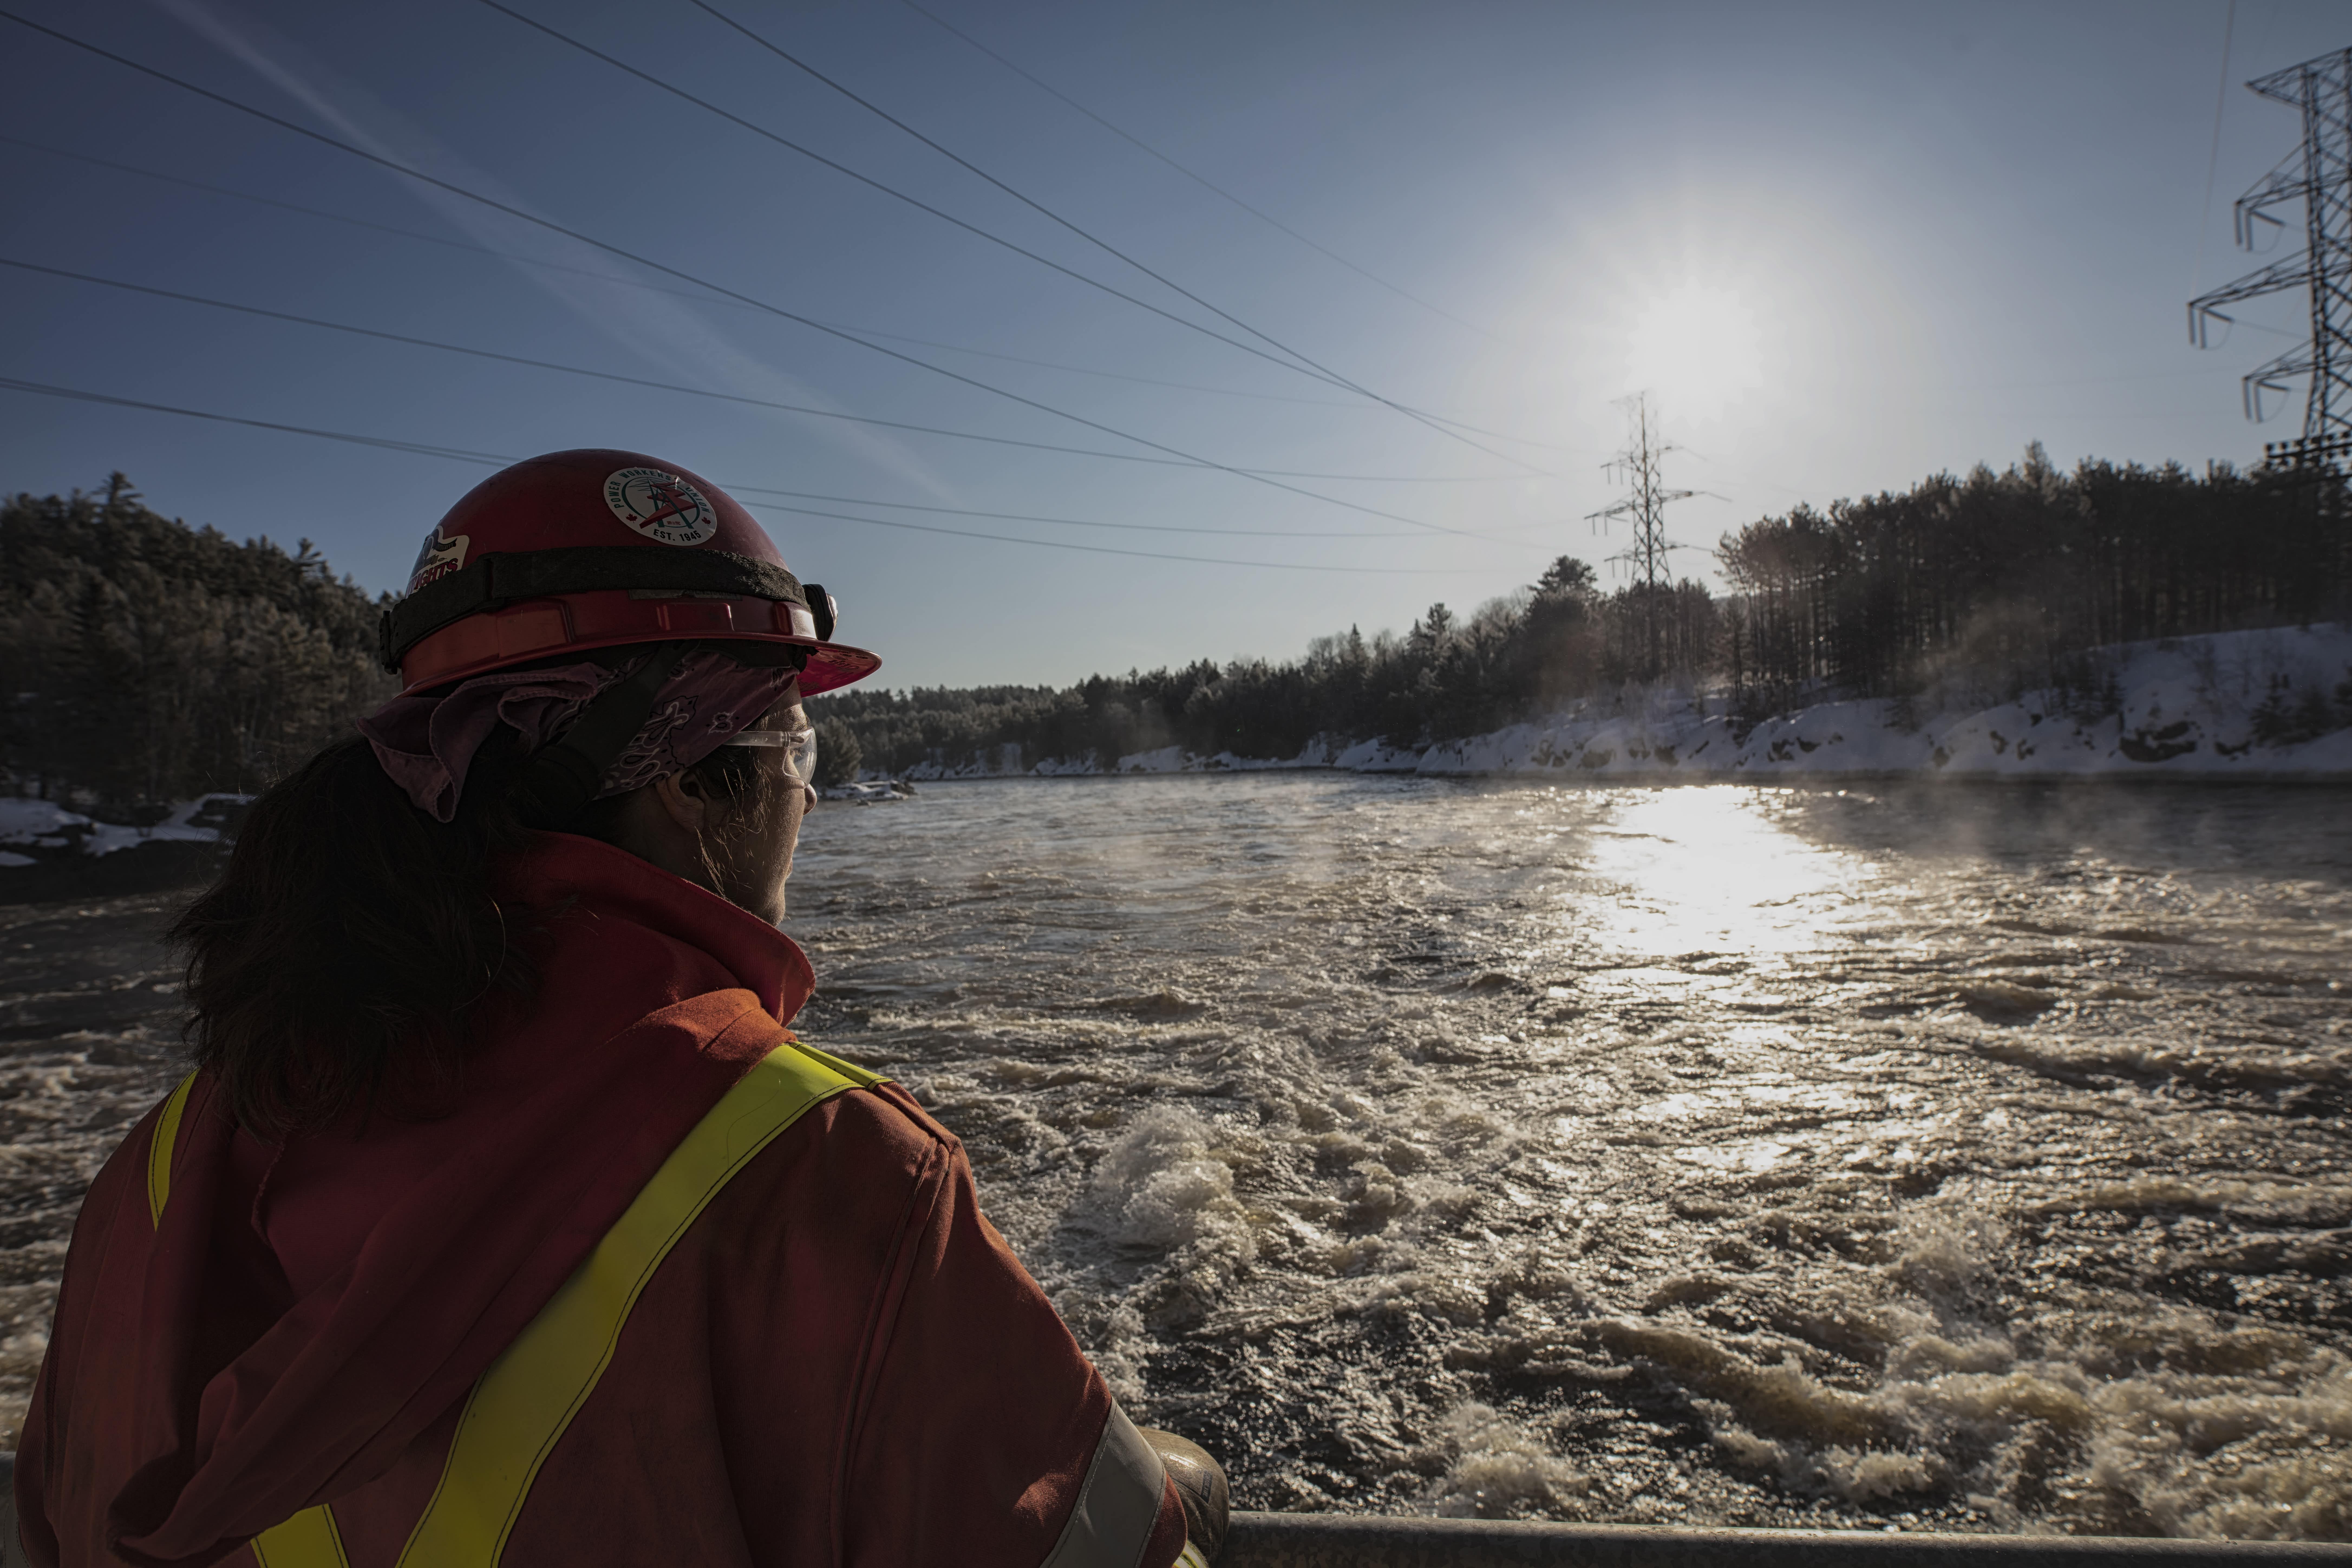
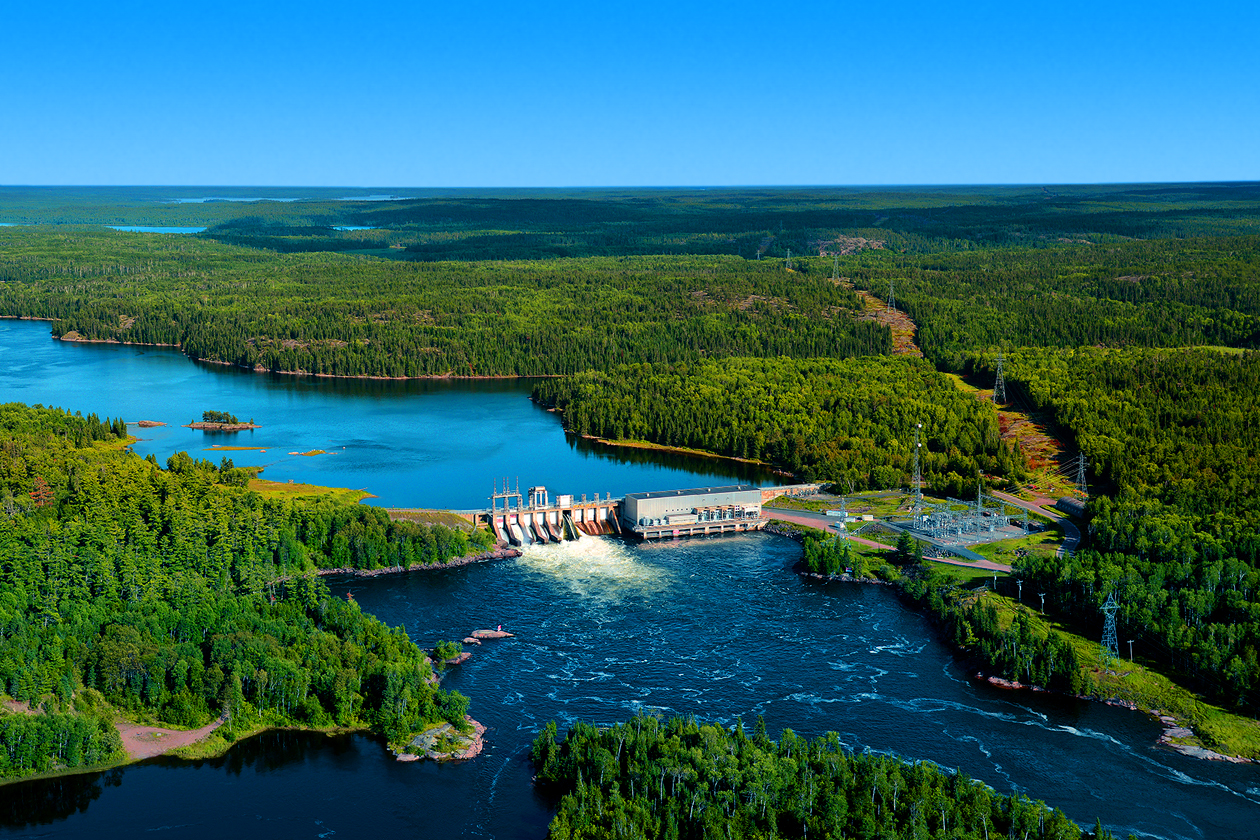
Around hydro stations, dams and surrounding waterways.
Water Levels
River System Data
Ontario Power Generation operates 66 hydroelectric stations and 239 dams on 24 river systems.
WATER LEVELS
Northwest
| Aguasabon River | 12/14 | 12/15 | 12/16 | 12/17 | 12/18 | 12/19 | 12/20 | |
|---|---|---|---|---|---|---|---|---|
| Kenogami Control Dam | Level | - | - | - | - | - | - | - |
| Graphs and Advanced Data | Flow | 0.8 | 0.8 | 0.8 | 0.8 | 0.8 | 0.8 | 0.8 |
| Long Lake Control Dam | Level | - | - | - | - | - | - | - |
| Graphs and Advanced Data | Flow | 9.9 | 9.9 | 18.5 | 27.8 | 27.5 | 27.2 | 22.7 |
| Long Lake | Level | 312.33 | 312.33 | 312.33 | 312.33 | 312.31 | 312.30 | 312.29 |
| Graphs and Advanced Data | Flow | - | - | - | - | - | - | - |
| Aguasabon Generating Station | Level | 273.43 | 273.44 | 273.46 | 273.50 | 273.60 | 273.71 | 273.82 |
| Graphs and Advanced Data | Flow | 17.7 | 17.7 | 24.4 | 26.9 | 30.8 | 31.0 | 31.0 |
| English River | 12/14 | 12/15 | 12/16 | 12/17 | 12/18 | 12/19 | 12/20 | |
|---|---|---|---|---|---|---|---|---|
| Cedars Channels Control Dam | Level | - | - | - | - | - | - | - |
| Graphs and Advanced Data | Flow | - | - | - | - | - | - | - |
| Rat Rapids Control Dam | Level | - | - | - | - | - | - | - |
| Graphs and Advanced Data | Flow | - | - | - | - | - | - | - |
| Root River Control Dam | Level | - | - | - | - | - | - | - |
| Graphs and Advanced Data | Flow | - | - | - | - | - | - | - |
| Ear Falls/Lac Seul Generating Station | Level | - | - | - | - | - | - | - |
| Graphs and Advanced Data | Flow | - | - | - | - | - | - | - |
| Manitou Falls Generating Station | Level | - | - | - | - | - | - | - |
| Graphs and Advanced Data | Flow | - | - | - | - | - | - | - |
| Caribou Falls Generating Station | Level | - | - | - | - | - | - | - |
| Graphs and Advanced Data | Flow | - | - | - | - | - | - | - |
| Kaministiquia River | 12/14 | 12/15 | 12/16 | 12/17 | 12/18 | 12/19 | 12/20 | |
|---|---|---|---|---|---|---|---|---|
| Kashabowie Control Dam | Level | 458.97 | 458.96 | 458.95 | 458.95 | 458.94 | 458.93 | 458.93 |
| Graphs and Advanced Data | Flow | 2.8 | 2.7 | 2.7 | 2.6 | 2.6 | 2.5 | 2.5 |
| Greenwater Lake Control Dam | Level | 453.50 | 453.50 | 453.50 | 453.50 | 453.50 | 453.50 | 453.50 |
| Graphs and Advanced Data | Flow | 0.2 | 0.2 | 0.3 | 0.3 | 0.3 | 0.3 | 0.3 |
| Shebandowan Lake Control Dam | Level | 449.84 | 449.84 | 449.84 | 449.84 | 449.83 | 449.82 | 449.82 |
| Graphs and Advanced Data | Flow | 6.3 | 6.2 | 6.2 | 6.2 | 6.2 | 6.0 | 6.0 |
| Silver Falls Generating Station | Level | 419.69 | 419.68 | 419.67 | 419.66 | 419.65 | 419.64 | 419.63 |
| Graphs and Advanced Data | Flow | 20.8 | 20.7 | 20.4 | 20.7 | 21.4 | 22.4 | 22.2 |
| Upper Kam River (Dog River) at Hydroline | Level | 304.19 | 304.19 | 304.18 | 304.19 | 304.19 | 304.21 | 304.22 |
| Graphs and Advanced Data | Flow | 18.5 | 18.4 | 18.2 | 18.4 | 18.6 | 19.4 | 19.7 |
| Kakabeka Falls Generating Station | Level | 277.84 | 277.84 | 277.84 | 277.80 | 277.76 | 277.87 | 277.91 |
| Graphs and Advanced Data | Flow | 25.9 | 31.8 | 31.6 | 30.8 | 28.4 | 28.9 | 30.0 |
| Nipigon River | 12/14 | 12/15 | 12/16 | 12/17 | 12/18 | 12/19 | 12/20 | |
|---|---|---|---|---|---|---|---|---|
| Waboose Control Dam | Level | 324.97 | 324.97 | 324.98 | 324.99 | 324.99 | 324.99 | 324.99 |
| Graphs and Advanced Data | Flow | 1.8 | 1.8 | 1.8 | 1.8 | 1.8 | 1.8 | 1.8 |
| Mojikit Lake | Level | 324.72 | 324.72 | 324.72 | 324.73 | 324.74 | 324.74 | 324.74 |
| Graphs and Advanced Data | Flow | - | - | - | - | - | - | - |
| Ogoki Reservoir | Level | 324.84 | 324.84 | 324.85 | 324.86 | 324.86 | 324.86 | 324.87 |
| Graphs and Advanced Data | Flow | - | - | - | - | - | - | - |
| Summit Control Dam | Level | - | - | - | - | - | - | - |
| Graphs and Advanced Data | Flow | 58.2 | 58.3 | 59.2 | 60.2 | 60.7 | 60.5 | 60.5 |
| Lake Nipigon | Level | 259.50 | 259.50 | 259.50 | 259.50 | 259.50 | 259.49 | 259.49 |
| Graphs and Advanced Data | Flow | - | - | - | - | - | - | - |
| Pine Portage Generating Station | Level | 259.35 | 259.34 | 259.34 | 259.37 | 259.37 | 259.35 | 259.35 |
| Graphs and Advanced Data | Flow | - | - | - | - | - | - | - |
| Cameron Falls Generating Station | Level | 227.23 | 227.18 | 227.25 | 227.23 | 227.21 | 227.23 | 227.28 |
| Graphs and Advanced Data | Flow | - | - | - | - | - | - | - |
| Alexander Generating Station | Level | 203.22 | 203.20 | 203.20 | 203.22 | 203.23 | 203.27 | 203.26 |
| Graphs and Advanced Data | Flow | 272.9 | 270.5 | 273.4 | 274.7 | 275.7 | 274.7 | 270.4 |
| Winnipeg River | 12/14 | 12/15 | 12/16 | 12/17 | 12/18 | 12/19 | 12/20 | |
|---|---|---|---|---|---|---|---|---|
| Whitedog Falls Generating Station | Level | - | - | - | - | - | - | - |
| Graphs and Advanced Data | Flow | - | - | - | - | - | - | - |


River system data
Hydroelectric power is a clean, reliable, and low-cost way to produce the energy Ontario needs.
Ontario Power Generation (OPG) operates 66 hydroelectric stations and 239 dams on 24 river systems. These facilities help produce clean, reliable and low-cost electricity for Ontario.
This site provides information on water levels and flows at OPG hydroelectric facilities. Data is continuously collected using gauges that help safely manage OPG’s stations and dams in watersheds across the province.
