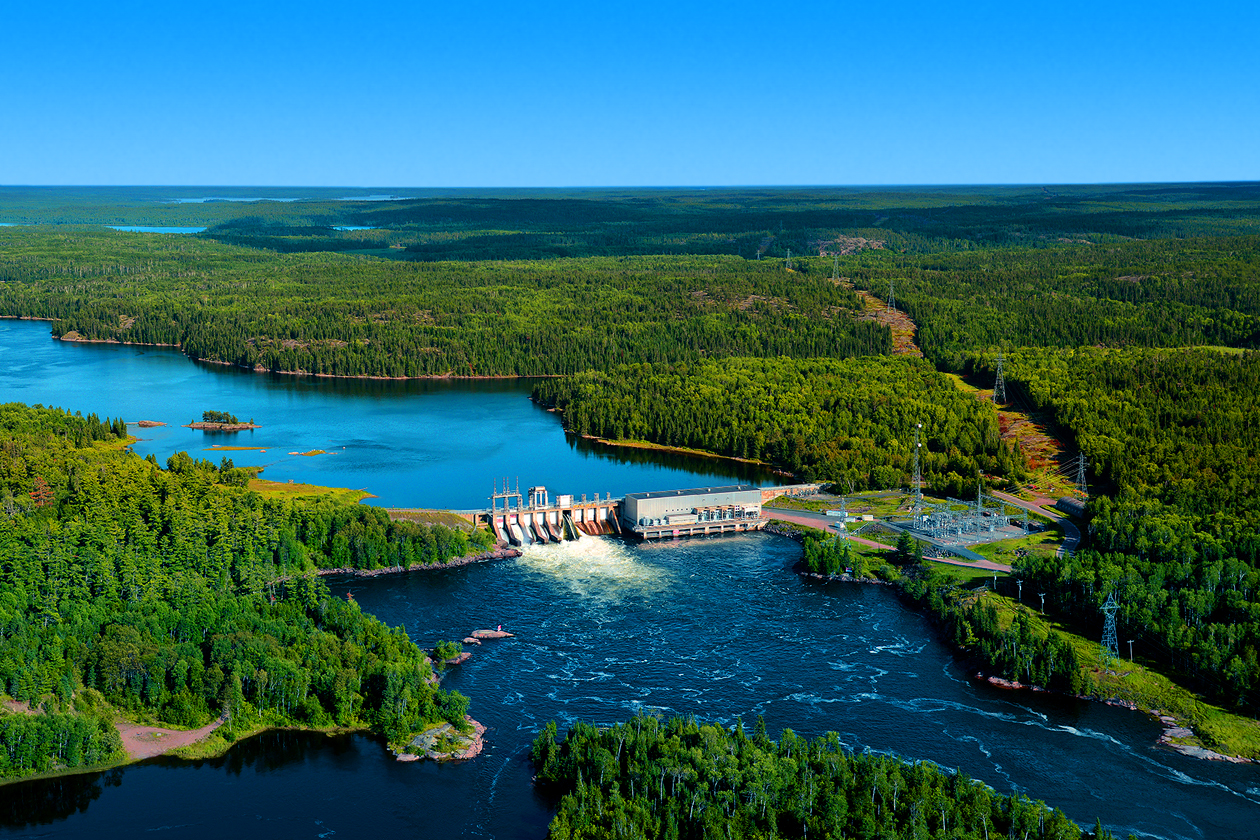
Around hydro stations, dams and surrounding waterways.
Water Levels
River System Data
Ontario Power Generation operates 66 hydroelectric stations and 239 dams on 24 river systems.
WATER LEVELS
South Central
| Beaver River | 6/29 | 6/30 | 7/01 | 7/02 | 7/03 | 7/04 | 7/05 | |
|---|---|---|---|---|---|---|---|---|
| Eugenia Falls Generating Station | Level | 434.12 | 434.14 | 434.17 | 434.16 | 434.16 | 434.15 | - |
| Graphs and Advanced Data | Flow | 1.9 | 2.2 | 2.6 | 2.6 | 2.6 | 2.6 | - |
| Mississippi River | 6/29 | 6/30 | 7/01 | 7/02 | 7/03 | 7/04 | 7/05 | |
|---|---|---|---|---|---|---|---|---|
| Crotch Lake Control Dam | Level | 239.47 | - | - | - | - | - | - |
| Graphs and Advanced Data | Flow | 0.8 | - | - | - | - | - | - |
| High Falls Generating Station | Level | 187.36 | 187.39 | 187.42 | 187.43 | 187.47 | 187.51 | - |
| Graphs and Advanced Data | Flow | 4.3 | 4.8 | 5.1 | 4.4 | 4.0 | 4.3 | - |
| Muskoka Watershed | 6/29 | 6/30 | 7/01 | 7/02 | 7/03 | 7/04 | 7/05 | |
|---|---|---|---|---|---|---|---|---|
| Trethewey Falls Generating Station | Level | 279.22 | 279.22 | 279.18 | 279.19 | 279.14 | 278.95 | - |
| Graphs and Advanced Data | Flow | 31.7 | 31.1 | 29.6 | 28.7 | 28.9 | 28.5 | - |
| Hanna Chute Generating Station | Level | 268.58 | 268.61 | 268.51 | 268.52 | 268.58 | 268.58 | - |
| Graphs and Advanced Data | Flow | 35.4 | 36.0 | 35.5 | 33.1 | 33.0 | 33.6 | - |
| South Falls Generating Station | Level | 258.98 | 259.08 | 258.99 | 259.04 | 259.02 | 259.07 | - |
| Graphs and Advanced Data | Flow | 33.3 | 33.7 | 33.3 | 30.3 | 30.3 | 31.3 | - |
| Bala Reach | Level | 219.54 | 219.43 | 219.29 | 219.28 | 219.25 | 219.20 | - |
| Graphs and Advanced Data | Flow | 101.6 | 88.9 | 80.1 | 77.6 | 69.8 | 63.2 | - |
| Moon River Control Dam | Level | 219.15 | 219.09 | 218.92 | 218.93 | 218.95 | 218.94 | - |
| Graphs and Advanced Data | Flow | 19.0 | 5.4 | 0.0 | 0.0 | 0.0 | 0.0 | - |
| Ragged Rapids Generating Station | Level | 218.88 | 218.80 | 218.63 | 218.66 | 218.73 | 218.76 | - |
| Graphs and Advanced Data | Flow | 82.8 | 83.8 | 80.1 | 77.6 | 69.8 | 63.2 | - |
| Big Eddy Generating Station | Level | 207.26 | 207.25 | 207.24 | 207.15 | 207.18 | 207.13 | - |
| Graphs and Advanced Data | Flow | 90.8 | 89.3 | 89.0 | 85.7 | 78.2 | 70.0 | - |
| Niagara River | 6/29 | 6/30 | 7/01 | 7/02 | 7/03 | 7/04 | 7/05 | |
|---|---|---|---|---|---|---|---|---|
| Sir Adam Beck No. 1 Generating Station | Level | - | - | - | - | - | - | - |
| Graphs and Advanced Data | Flow | - | - | - | - | - | - | - |
| Sir Adam Beck No. 2 Generating Station | Level | - | - | - | - | - | - | - |
| Graphs and Advanced Data | Flow | - | - | - | - | - | - | - |
| DeCew Falls I Generating Station | Level | - | - | - | - | - | - | - |
| Graphs and Advanced Data | Flow | - | - | - | - | - | - | - |
| DeCew Falls II Generating Station | Level | - | - | - | - | - | - | - |
| Graphs and Advanced Data | Flow | - | - | - | - | - | - | - |
| International Control Dam | Level | - | - | - | - | - | - | - |
| Graphs and Advanced Data | Flow | - | - | - | - | - | - | - |
| Rideau River | 6/29 | 6/30 | 7/01 | 7/02 | 7/03 | 7/04 | 7/05 | |
|---|---|---|---|---|---|---|---|---|
| Merrickville Generating Station | Level | - | - | - | - | - | - | - |
| Graphs and Advanced Data | Flow | - | - | - | - | - | - | - |
| Severn River | 6/29 | 6/30 | 7/01 | 7/02 | 7/03 | 7/04 | 7/05 | |
|---|---|---|---|---|---|---|---|---|
| Big Chute Generating Station | Level | 198.11 | 198.10 | 198.11 | 198.10 | 198.12 | 198.11 | - |
| Graphs and Advanced Data | Flow | 12.4 | 16.5 | 14.4 | 18.3 | 13.0 | 12.0 | - |
| Trent River | 6/29 | 6/30 | 7/01 | 7/02 | 7/03 | 7/04 | 7/05 | |
|---|---|---|---|---|---|---|---|---|
| Lakefield Generating Station | Level | - | - | - | - | - | - | - |
| Graphs and Advanced Data | Flow | - | - | - | - | - | - | - |
| Auburn Generating Station | Level | - | - | - | - | - | - | - |
| Graphs and Advanced Data | Flow | - | - | - | - | - | - | - |
| Healey Falls Generating Station | Level | - | - | - | - | - | - | - |
| Graphs and Advanced Data | Flow | - | - | - | - | - | - | - |
| Seymour Generating Station | Level | - | - | - | - | - | - | - |
| Graphs and Advanced Data | Flow | - | - | - | - | - | - | - |
| Ranney Falls Generating Station | Level | - | - | - | - | - | - | - |
| Graphs and Advanced Data | Flow | - | - | - | - | - | - | - |
| Hagues Reach Generating Station | Level | - | - | - | - | - | - | - |
| Graphs and Advanced Data | Flow | - | - | - | - | - | - | - |
| Meyersburg Generating Station | Level | - | - | - | - | - | - | - |
| Graphs and Advanced Data | Flow | - | - | - | - | - | - | - |
| Sills Island Generating Station | Level | - | - | - | - | - | - | - |
| Graphs and Advanced Data | Flow | - | - | - | - | - | - | - |
| Frankford Generating Station | Level | - | - | - | - | - | - | - |
| Graphs and Advanced Data | Flow | - | - | - | - | - | - | - |
| Sidney Generating Station | Level | - | - | - | - | - | - | - |
| Graphs and Advanced Data | Flow | - | - | - | - | - | - | - |


River system data
Hydroelectric power is a clean, reliable, and low-cost way to produce the energy Ontario needs.
Ontario Power Generation (OPG) operates 66 hydroelectric stations and 239 dams on 24 river systems. These facilities help produce clean, reliable and low-cost electricity for Ontario.
This site provides information on water levels and flows at OPG hydroelectric facilities. Data is continuously collected using gauges that help safely manage OPG’s stations and dams in watersheds across the province.
