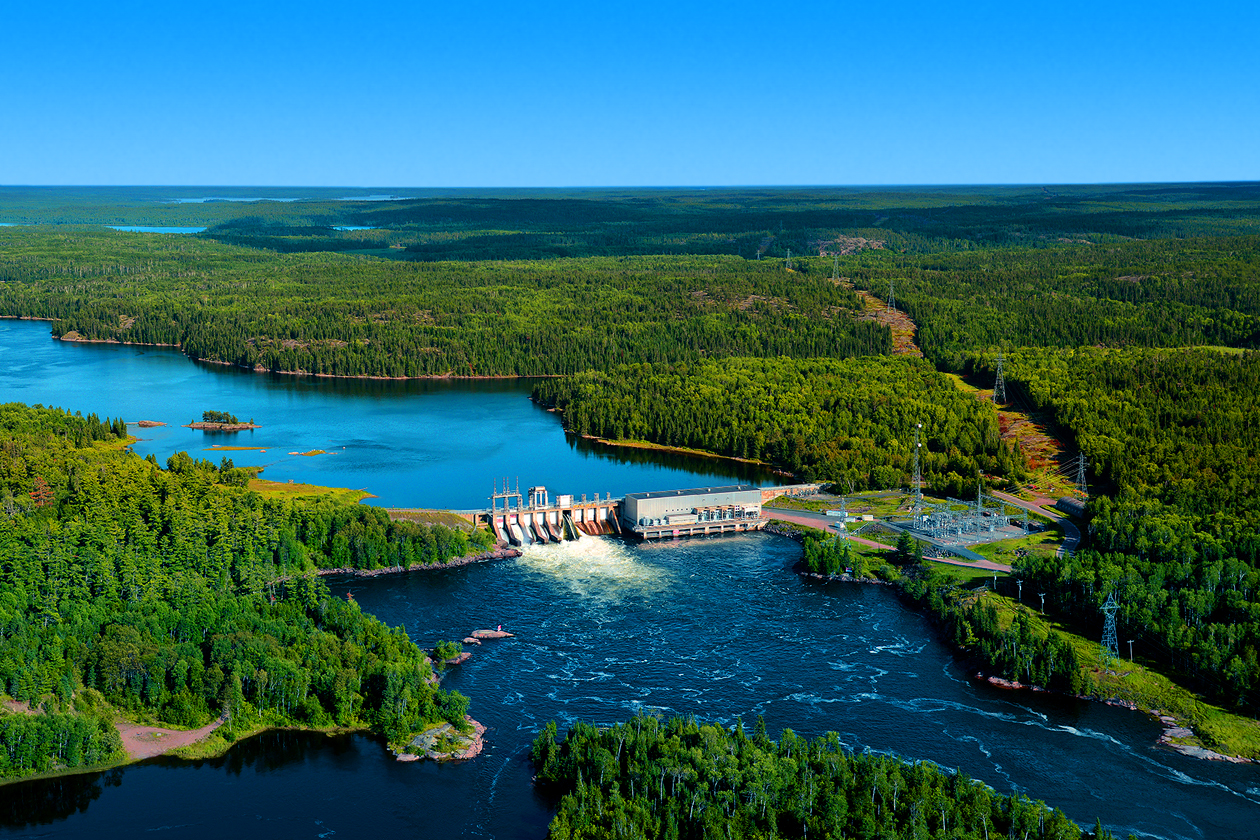
Around hydro stations, dams and surrounding waterways.
Water Levels
River System Data
Ontario Power Generation operates 66 hydroelectric stations and 239 dams on 24 river systems.
WATER LEVELS
Southeast
| Madawaska River | 11/17 | 11/18 | 11/19 | 11/20 | 11/21 | 11/22 | 11/23 | |
|---|---|---|---|---|---|---|---|---|
| Bark Lake Control Dam | Level | 312.85 | 312.85 | 312.85 | 312.85 | 312.85 | 312.85 | 312.85 |
| Graphs and Advanced Data | Flow | 9.9 | 9.9 | 9.9 | 9.9 | 9.9 | 9.9 | 9.9 |
| Kamaniskeg Lake Control Dam | Level | 283.07 | 283.08 | 283.07 | 283.06 | 283.05 | 283.04 | 283.03 |
| Graphs and Advanced Data | Flow | 15.7 | 18.6 | 22.6 | 22.3 | 22.0 | 21.8 | 21.5 |
| Palmer Rapids | Level | - | - | - | - | - | - | - |
| Graphs and Advanced Data | Flow | 15.7 | 18.6 | 22.6 | 22.3 | 22.0 | 21.8 | 21.5 |
| Mountain Chute Generating Station | Level | 248.14 | 248.11 | 248.09 | 248.08 | 248.09 | 248.11 | 248.11 |
| Graphs and Advanced Data | Flow | 25.1 | 28.8 | 28.9 | 21.7 | 14.4 | 29.0 | 7.2 |
| Barrett Chute Generating Station | Level | 200.85 | 200.86 | 200.82 | 200.84 | 200.82 | 200.79 | 200.80 |
| Graphs and Advanced Data | Flow | 25.7 | 29.1 | 31.7 | 24.3 | 19.6 | 26.5 | 14.0 |
| Calabogie Generating Station | Level | 154.00 | 153.93 | 153.80 | 153.66 | 153.63 | 153.63 | 153.64 |
| Graphs and Advanced Data | Flow | 25.1 | 47.5 | 53.8 | 39.2 | 17.3 | 24.1 | 17.8 |
| Stewartville Generating Station | Level | 144.42 | 144.43 | 144.28 | 144.13 | 144.03 | 143.86 | 143.72 |
| Graphs and Advanced Data | Flow | 23.4 | 48.7 | 58.9 | 49.1 | 23.1 | 29.1 | 21.5 |
| Arnprior Generating Station | Level | 98.88 | 98.88 | 98.89 | 98.88 | 98.91 | 98.90 | 98.90 |
| Graphs and Advanced Data | Flow | 26.4 | 47.9 | 69.7 | 52.7 | 26.5 | 35.1 | 26.4 |
| Ottawa River | 11/17 | 11/18 | 11/19 | 11/20 | 11/21 | 11/22 | 11/23 | |
|---|---|---|---|---|---|---|---|---|
| Otto Holden Generating Station | Level | 177.14 | 177.12 | 177.14 | 177.11 | 177.10 | 177.15 | 177.15 |
| Graphs and Advanced Data | Flow | 345.7 | 337.1 | 328.4 | 343.9 | 346.2 | 340.9 | 331.1 |
| Ottawa River at Mattawa | Level | 152.19 | 152.17 | 152.17 | 152.19 | 152.20 | 152.20 | 152.20 |
| Graphs and Advanced Data | Flow | - | - | - | - | - | - | - |
| Des Joachims Generating Station | Level | 152.07 | 152.03 | 152.03 | 152.01 | 152.02 | 152.04 | 152.04 |
| Graphs and Advanced Data | Flow | 420.1 | 379.4 | 375.6 | 382.0 | 371.4 | 386.2 | 382.4 |
| Pembroke | Level | 111.09 | 111.06 | 111.04 | 111.04 | 111.05 | 111.05 | 111.04 |
| Graphs and Advanced Data | Flow | - | - | - | - | - | - | - |
| Chenaux Generating Station | Level | 86.31 | 86.24 | 86.22 | 86.16 | 86.07 | 86.07 | 86.04 |
| Graphs and Advanced Data | Flow | 505.0 | 495.0 | 485.0 | 463.2 | 423.9 | 430.6 | 428.6 |
| Chats Falls Generating Station | Level | 74.06 | 74.05 | 74.05 | 74.07 | 74.04 | 74.02 | 74.01 |
| Graphs and Advanced Data | Flow | 550.8 | 576.0 | 563.5 | 549.0 | 474.3 | 504.6 | 460.2 |
| Ottawa River at Britannia | Level | 57.80 | 57.80 | 57.81 | 57.80 | 57.79 | 57.77 | 57.75 |
| Graphs and Advanced Data | Flow | - | - | - | - | - | - | - |
| St. Lawrence River | 11/17 | 11/18 | 11/19 | 11/20 | 11/21 | 11/22 | 11/23 | |
|---|---|---|---|---|---|---|---|---|
| R.H. Saunders Generating Station | Level | - | - | - | - | - | - | - |
| Graphs and Advanced Data | Flow | - | - | - | - | - | - | - |


River system data
Hydroelectric power is a clean, reliable, and low-cost way to produce the energy Ontario needs.
Ontario Power Generation (OPG) operates 66 hydroelectric stations and 239 dams on 24 river systems. These facilities help produce clean, reliable and low-cost electricity for Ontario.
This site provides information on water levels and flows at OPG hydroelectric facilities. Data is continuously collected using gauges that help safely manage OPG’s stations and dams in watersheds across the province.
